Guided lessons, labs and practical exercises.
ONLINE & CLASSROOM
Data Analysis
Training.
- Learn Data Analysis with a clear, structured curriculum.
- Train with industry-focused concepts and tools.
- Choose classroom or online instructor-led learning.
- Practice with Microsoft Excel and Advanced SQL in guided exercises.
- Build projects and prepare for interviews with support.

LEARNX / COURSE
6 curriculum modules
From raw data to clearer decisions.
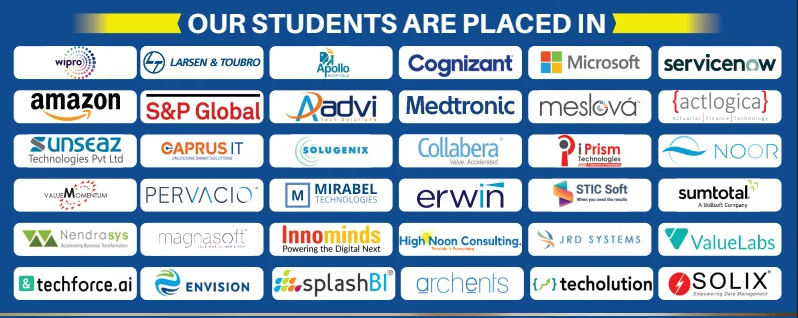
ALUMNI NETWORKCOMPANIES WHERE LEARNX LEARNERS BUILD THEIR CAREERS
















































Data Analysis, made simple.
Everything you need to understand the course before you begin.
Microsoft Excel · Advanced SQL · Python
Projects designed to help you explain your skills.
Make it more
than something you know.
Discover the story inside the data. Build your foundation in analysis, visualization and turning information into useful insight. Move beyond understanding the concepts. Practice using them, connect the pieces, and build work you can explain.
Microsoft ExcelAdvanced SQLPythonPandasNumPyPower BITableauMatplotlib & SeabornJupyter NotebooksGoogle SheetsETL PipelinesStatistical Analysis
DIRECTIONS YOU CAN EXPLORELearning supports your preparation. Role requirements and opportunities vary.
Data Analyst
Reporting Analyst
Business Data Analyst
IS THIS THE RIGHT COURSE FOR YOU?Start where you are.
Start where you are.
Build toward where you want to go.
This path is designed for curious learners who want a structured way to practise Data Analysis and create evidence of their progress.
01You want a clear, guided path instead of random tutorials.
02You learn best by trying ideas, getting feedback and improving.
03You want practical work you can confidently discuss.
Learn the tools.
Understand the thinking.
Microsoft Excel
Use it in context through guided practice and applied exercises.
Advanced SQL
Use it in context through guided practice and applied exercises.
Python
Use it in context through guided practice and applied exercises.
Pandas
Use it in context through guided practice and applied exercises.
NumPy
Use it in context through guided practice and applied exercises.
Power BI
Use it in context through guided practice and applied exercises.
Tableau
Use it in context through guided practice and applied exercises.
Matplotlib & Seaborn
Use it in context through guided practice and applied exercises.
Jupyter Notebooks
Use it in context through guided practice and applied exercises.
Google Sheets
Use it in context through guided practice and applied exercises.
ETL Pipelines
Use it in context through guided practice and applied exercises.
Statistical Analysis
Use it in context through guided practice and applied exercises.
A path that
makes sense.
Understand
Learn the core ideas and build your foundation.
Practise
Use the tools in short labs and guided challenges.
Build
Connect your skills in meaningful project work.
Explain
Share your approach, choices and outcomes with confidence.
ONE CONCEPT BUILDS ON THE NEXT
6 modulesThe curriculum.
A closer look at what you’ll explore. Open a module to see the topics inside.
01Excel
- Introduction to Excel
- Customizing tabs, options in excel
- Name managers
- Data validation: Options in data validation for list, whole numbers, dates
- Using name manager for data validation
- Sorting
- Custom sorting
- Subtotals
- Sorting left to right
- Advanced sorting with multiple options
- Advanced filter options
- Sorting and filtering with color options
- Pivot tables
- Short cuts to create pivot tables
- Changing row and column labels
- Custom format tables and default tables
- Changing number formats
- Value field settings and summarizing values by 11 different options
- Value field settings and showing values as different options
- Grouping of continuous fields
- Pivot charts, compared regular charts
- Slicers, Slicer settings, advanced slicer
- Calculated fields in pivot tables
- Vlookup and Hlookup
- Syntax for Vlookup
- What-if there are errors
- Vlookup with data validation
- Approximation for Vlookup
- Using column function for dynamic column numbers
- Using Choose function to select a table for Vlookup
- Using Match function to identify column number
- Locking cells for absolute and relative cells
- Formulae
- Auto sum functions
- Logical functions
- Text functions
- Date and Time functions
- Lookup and reference functions
- Information functions
- Charts
- Column charts
- Line charts
- Pie charts, Pie in pie and Bar of pie, Donut
- Stacker bar and clustered bar charts
- Area
- Scatter charts
- Radar charts
- Tree maps
- Histogram
- Waterfall
- Funnel
- Combo
- Conditional formatting
- Duplicate values
- Alternate rows
- Multiple criteria
- Negative numbers
- Gantt charts and Formula
- Advanced topics
- What-if analysis
- Text to columns
- Flash fill
- Remove duplicates, Consolidate
- Grouping, ungrouping and sub-totals
- Freezing and unfreezing panes
02Tableau
- Start
- Understanding the start pane
- Connecting to data source
- Data sources that can be connected
- Various file formats
- Bookmarks
- TDS, TDE
- Connecting to excel, Joins, Splitting data
- Live and extract
- Dimensions and measures
- Clearing sorts and filters
- Views: Standard fit width and height
- Drilling down
- Expanding the marks in pane
- Swapping axis
- Renaming sheets
- Editing color pane
- Adding highlighters
- Understanding show me
- Sorting and hierarchy
- Data pane and analytics pane
- Different view options at bottom of sheet
- Managing data and extracts
- Hiding and unhiding fields
- Creating folders to move dimensions and measures
- Adding default colors and properties
- Adding multiple data sources
- Extracting workbook
- Replacing data sources
- Data cleansing
- Database joins
- Blending
- Sorting and Filtering
- Default charts
- Highlighter for color and shape
- Sorting from axis, color, category, manually and clearing sort
- Creating groups from pane, manually, visually, parameters, and bins
- Adding filter, show filter, wildcards, Top N parameters
- Discrete and continuous dates
- Types of filters: Applying to specific sheets, Editing page shelf
- Hiding cards
- Sets and parameters
- Sets
- Parameters
- Tool tips
- Cluster analysis
- Formatting
- Dashboards and storyboards
- Building dashboards
- Hiding and unhiding sheets
- Interface between sheets, dashboard and storyboard
- Elements in dashboard
- Actions in dashboard
- Device designer
- Story points
- Charts
- Word cloud
- Bump charts
- Box and whisker
- Funnel
- Step and Line
- Pareto
- Waterfall
- Donut
- Lollipop
- Pie
- Heat map
- Waffle
- Show me charts
- Calculations
- Basic syntax
- Regular calc and table calc
- Adding totals
- Date calc
- Logic calc
- String calc
- Number calc
- LODs
- Maps
- Mapbox
- WMS Layers
- Converting geo to non-geo
- Chart default
- Options for maps
- Unrecognized locations
- Groups
03Qilkview
- Basics
- Selections
- Importing data
- Scripting basics
- Configuring sheets
- Creating and configuring sheets
- List boxes
- Input boxes
- Pivots and Sets
- Pivot tables
- Set analysis
- Lookup and apply map functions
- Expressions
- Joins
- Sliders
- Resident load
- Text objects
- Statistics box
- Creating PDFs
- Cyclic dimensions
- Multiple topics
- Table box
- Multi box
- Button objects
- Combo charts
- Bar charts
- Line charts
- Pie charts
- Scatter charts
- Load inline
- Concatenation
- Straight table
- Waterfall
- Block charts
- Trellis bar
- Grid charts
- Mekko
- Funnel
- Mini
- Interchanging bar and Line
- Radar
- Step/line
- Magic quadrant
- Heat map
- References in chart
- Custom labels
- Bookmarks
- Before and after functions
- Triggers
- Pareto
- Container objects
- Search objects
04M S Access
- Creating blank database
- Creating table at backend table design view
- Adding data
- Creating select query
- Queries
- Query criteria
- Action queries
- Create queries
- Delete query
- Table query
- Parameter queries
- Relationships
- Defining relationships between tables
- One-One
- One-many
- Many-many
- Wildcards
- Calculated expressions
- Indexing
- Grouping
- Summarizing data
- Joins
- Inner
- Outer
- Left
- Right
- Self
- Query wizard
- Forms
- Multiple forms
- Split forms
- Modify forms
- Themes
- Navigation forms
- Combo box
- SQL view
- Formatting
- Controls and properties
- Reports basics
- Formatting reports
- Functions
05SQL
- intro
- Syntax
- Select
- Distinct
- Where
- And Or Not
- Order By
- Insert into
- Null values
- Update
- Delete
- Top
- Min and Max
- Count, Avg, sum
- Like
- Wildcards
- In
- Between
- Alias
- Joins
- Inner
- Left
- Right
- Full
- Self
- Union
- Group By
- Having
- Exists
- Create table
- Drop table
- Alter table
- Not null
- Unique
- Primary key
- Default
- Views
- Operators
06POWER BI
- Intro
- Connecting to database, basic transformation
- Managing queries, splitting columns
- Modifying data types
- Dates
- Re-ordering columns, conditional columns
- Connecting to folders
- Merge queries
- Query dependency
- Transform data
- Enter data
- Query parameter
- Data modeling
- Data relationships
- Calculated columns
- Quick measures
- Optimize models
- Calculated measures
- Hierarchies
- Calculated tables
- Time intelligence
- Insert new data tables
- Include/Exclude
- Grouping and Binning
- Visualizations
- Create and format visualizations
- Hierarchical axis and concatenating
- Filters
- Combo charts
- Forecasting
- Clustering data
- Slicers
- Data behind visualization
- Date slicers
- Maps, ESRI maps
- Tables and matrixes
- Table style
- Scatter charts
- Waterfall and funnel charts
- Gauge, cards and KPIs
- Coloring charts
- Shapes, grid lines, page settings
- Duplicates, categories with no data
- Aligning, hierarchies
- Charts
- Custom visual store
- Date slicer
- Grouping and binning
- Map visualizations
- Report measures
- Tables and matrices
- Turn off visual headers
- Persistent filters
- Sync slicers
- Buttons
- Custom date tables
- Default summarization
- Measure filtering
- Excel data and collaboration
- Upload an excel table
- Excel data with BI content
- Pinning excel tables
- Analyze in excel
- Workspaces
- Power BI service
- Overview of dashboards
- Publish from Power BI
- Get insights
- Pinning on dashboards, dashboard tiles, display options
- Adding widgets
- Navigating content
- Filter the list in navigating pane
- Dashboard settings
- Sharing, print and export dashboards
- Focus mode
- Export to csv or excel or ppt
- Notifications, alerts
- Subscriptions
- Publishing
Have a question about the syllabus?
Tools & platforms you’ll master.
Practise with the core technologies, developer software, libraries and platforms used in modern Data Analysis workflows.










Learn it.
Then make it work.
Explore project examples from the course. Practical work helps connect what you’ve learned.

PROJECT / 01
HR Analytics for Attrition Prediction using Logistic Regression
Explore project
Employee Attrition is an important subject to gauge the satisfaction of the employee in a company. HR departments take various measures to arrest employee attrition. In this project we will use Logistic regression to predict who is the potential employee who is in a verge of leaving the company. Industry: Human Resources Tools: Logistic Regression, Sklearn, Numpy, Pandas, Matplotlib Churn Analysis in Telecommunication

PROJECT / 02
Predicting Housing prices using Regression
Explore project
Predict the sales price for each house based on input features provided for the house. Industry: Real Estate Tools: Linear Regression, Multi Linear Regression, Sklearn, Pandas, Numpy, Matplotlib

PROJECT / 03
Retail Customer segmentation based on spending patterns
Explore project
Customer analysis plays a crucial role in determining the profitability of Retail companies. Segmentation of the customers based on their purchase patterns helps Retail companies to cluster their user base and serve them effectively. Industry: Retail Tools: K-Means, Clustering, Sklearn, Pandas, Numpy, Seaborn

PROJECT / 04
Stock market price prediction
Explore project
This project deals with the predictions of stock market prices using history of Data. It also considers the physical factors vs. psychological, rational and irrational behavior etc. Machine learning techniques implemented in Python acts as game changer for the predictions. Algorithms including Linear regression, LSTM and ARIMA model are used for the same. Industry: Finance Tools: Tensorflow, Keras, LSTM, RNN

PROJECT / 05
Exploratory Data analysis of Crime records in Boston
Explore project
This project analyses data using quantitative prediction of crimes in Boston and drawing visualizations of Trends in the data over the years. Exploratory Data Analysis is carried on the crimes data using lots of techniques from Linear model to Stochastic gradient boosting. Industry: Defense and Law Enforcement Tools: Linear Regression, XGBoost, Numpy, Sklearn, Pandas, Matplotlib

PROJECT / 06
Market Basket Analysis using Apriori Algorithm
Explore project
Market Basket Analysis is a technique which identifies the strength of association between pairs of products purchased together and identify patterns of co-occurrence. A co-occurrence is when two or more things take place together. The technique determines relationships of what products were purchased with which other product(s). Industry: Retail Tools: Apriori Algorithm, Numpy, Pandas
Less guessing.
More doing.
Try
Break down a concept with an instructor-led example.
Build
Apply it in a focused lab with a clear goal.
Check
Review what works, what does not and why.
Show
Keep the strongest work as evidence of your progress.
Build skills for
real possibilities.
The path you choose is personal. These are a few directions connected to the skills you’ll practise.
Room to ask.
Support to grow.
Flexible learning
Explore online and classroom options for your course.
Practical experience
Connect concepts through exercises, labs and projects.
Guided learning
Ask questions and develop understanding with support.
Career preparation
Explore portfolio development and interview preparation.
RECOGNITION FOR YOUR WORKFinish with a
Finish with a
certificate of completion.
Complete the Data Analysis learning path and its practical work to receive a LearnX Academy certificate of completion.
- Confirms your completed learning path
- Names the course or program you completed
- Supports your portfolio and job conversations
 LearnX Academy
This certificate recognises completion of
Data AnalysisLEARNX ACADEMY · VERIFIED LEARNINGYour questions.
Who should take this course?
- Our Data Analysis training has precisely been developed to reach out to the demand of the learners by keeping in mind the industry standards. This Data Analysis course will particularly be helpful for the career advancement of the following audience -
- Graduates from the College.
- Currently working employees looking to upskill themselves.
- Candidates looking for a change in the IT Field.
What are the prerequisites for the Course?
As such, there are no specific prerequisites for Data Analysis institutes in Hyderabad. If you are familiar with programming and foundation skills with a sense of curiosity and willingness to learn you are all set for the Data Analysis training.
When are the classes conducted?
Data Analysis Training Classes are conducted over the Weekdays and Weekends through classroom and online sessions. Please get in touch with the LearnX Academy team to get the exact schedule and timings.
Who are the Faculty?
Our Data Analysis faculty has over 12 years of experience.
What is the duration of the Course?
Data Analysis Course duration is 50 hours.
What is the duration of the class?
Weekday Data Analysis Training classes will be one hour long and Weekend classes will be three hours long.
What is the course curriculum?
Please find the detailed Data Analysis course curriculum in the LearnX Academy Data Analysis training curriculum section.
Do you help in Interview preparation?
Yes, we will assist our students with all the interview preparation techniques
✳KEEP YOUR OPTIONS OPEN
Another spark
of curiosity.



READY TO GET STARTED?Let’s plan
Let’s plan
your next step.
Tell us what you want to learn.
We’ll help you find a course that fits.